Energy and Health Impact Calculator: User Manual
Last updated: January 3, 2020
Contents
- Introduction
- Step-by-step instructions
- Outputs
- Exporting outputs
- Appendix A
- Acknowledgments
Introduction
About the Energy and Health Impact Calculator and this manual
The Energy and Health Impact Calculator is a free tool developed by Health Care Without Harm and Practice Greenhealth to help health care facilities and other users understand how the health care industry’s use of thermal energy and electricity can affect public health.
The Calculator focuses on public health impacts associated with exposure to air pollution. Health care facilities’ energy use contributes to air pollution when facilities burn fuel onsite or in a district energy system (for example, fuel burned to create chilled water, steam, space heating, water heating) and when they use electricity that was generated at power plants that burn fossil fuels. Impacts may be local, regional, and/or global, such as carbon dioxide and other greenhouse gases.
The Calculator is pre-populated with factors and formulas that convert thermal and electric energy use into emissions of several key air pollutants, then translate emissions into public health impacts, and finally translate these impacts into dollar values. All built-in factors are based on the best available data from credible, authoritative sources, including the U.S. EPA’s AVoided Emissions and geneRation Tool (AVERT), EPA’s AP-42 Compilation of Air Emissions Factors, EPA’s ENERGY STAR program, EPA’s Co-Benefits Risk Assessment Screening Model (COBRA), the Federal Reserve Bank of St. Louis, Northeast States for Coordinated Air Use Management’s “Economic Value of Human Health Benefits of Controlling Mercury Emissions from U.S. Coal-Fired Power Plants”, and other EPA documentation.
Users enter information about their use of electricity and thermal energy, their actual air pollution emissions, or proposed changes like an energy efficiency or renewable energy project. The Calculator converts this information into estimated health and welfare impacts, which include illness, premature mortality, missed workdays, and other health effects. Based on the geographic information provided by the user, the Calculator evaluates impacts using regionally appropriate factors.
This manual explains how to use the Calculator and provides important background information. This manual is intended for users with basic computer literacy, but does not assume any expertise in energy, public health, or economics.
Potential uses of the Calculator
The Calculator has a wide range of applications. While the tool has been designed for health care facilities, hospitals, and related entities, it can be used by anyone with information on their energy consumption. Based on electricity and/or thermal energy use, the Calculator estimates emissions and health and welfare impacts, and then calculates the total value of these impacts. Depending on how the tool is used, these values may be interpreted either as negative impacts of energy emissions, or as positive benefits associated with reductions in emissions. Results are presented quantitatively and visually, using built-in template charts and graphs. Table 1 summarizes the Calculator’s outputs.
Table 1 – Energy and Health Impact Calculator outputs
|
Output |
Details |
|
Emissions impacts |
Total emissions of the criteria pollutants nitrogen oxides (NOx), sulfur dioxide (SO2), and fine particulate matter (PM2.5), and total emissions of mercury (Hg), and carbon dioxide (CO2). |
|
Health and welfare impacts |
Total incidences of premature mortality, illnesses (heart attacks, respiratory ailments, etc.), missed workdays, and minor restricted activity days. |
|
Values |
Values of impacts in 2018 dollars. Reported as positive numbers, but may be interpreted either as a negative impact or a benefit (avoided negative impact) of reduced emissions. |
With results that are easy to understand, the Calculator helps users make decisions that can mitigate some or all of the unintended harmful effects of their electricity and delivered fuel consumption.
Updates made from the 2008 Energy Impact Calculator
This tool is a substantive rebuilding of Health Care Without Harm and Practice Greenhealth’s previous calculator (formerly the Healthcare Energy Impact Calculator), which was released in 2008. The new version conforms to the basic structure of the original version, with greatly expanded functionality, a more intuitive user experience, and greater transparency. Emissions, health, and economic data have all been updated.
Improvements in the new tool include:
- A streamlined inputs page that delivers results more quickly.
- The ability to evaluate impacts for thermal energy consumption.
- The ability to input specific renewable energy sources, with results that reflect the different grid impacts of these sources.
- The ability to assess impacts for both overall energy usage and changes in total energy usage.
- Updated emissions, health factors and impact values for every county in the United States reflecting current income and the most up-to-date research, including electricity emissions data.
- Extensive source documentation and complete transparency in the formulas available in the downloadable Excel version.
- Downloadable charts and graphs – available in Excel or the web version – can be inserted into customizable report templates to complement quantitative outputs.
- New normalizing metrics to capture the effects of energy consumption and/or a change in energy consumption or emissions based on metrics commonly used in the health care industry – for example, the number of beds or adjusted patient days.
Basic mechanics of the Calculator
The Calculator converts user-input electricity and thermal energy consumption data into expected health and welfare impacts (also called “endpoints” throughout the user manual), which include illness, premature mortality, missed workdays, and other effects. These results are valued using standardized rates, and both emissions and endpoint results, and their associated values, are output to the user.
Based on the geographic information provided by the user, the Calculator evaluates emissions impacts at the grid-regional level, predicting county-level associated emissions totals or emissions changes, using the EPA AVERT topology that divides the contiguous United States into ten discrete regions. Emissions impacts are evaluated similarly evaluated at the county-level for the entire contiguous United States.
This process can be visualized in five distinct steps, presented in the figure below.
Figure 1 - Calculation process
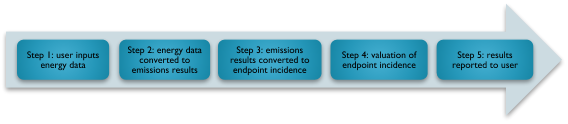
Note that the individual steps shown in Figure 1 may reflect multiple operations. In Step 2, for example, energy data is converted to emissions results using factors that are specific to the different energy sources, including grid electricity, renewable energy, and delivered fuel combustion, and that reflect whether the user is interested in evaluating total energy consumption or a change in energy consumption. Converting emissions to endpoint incidences in Step 3 involves the use of a transport model to predict where emissions from specific power plants in the region of interest will end up – and thus where they will end up impacting health and welfare.
Example user scenario
To provide a high-level illustration of how the Calculator operates, here is a sample case:
A sustainability officer at a small rural hospital in Minnesota is interested in quantifying the total impact of the hospital’s annual energy consumption. The 200,000 square foot hospital uses about 5,300 MWh of grid electricity each year, and about 21,000,000 cubic feet of natural gas each year. The sustainability officer inputs these figures into the Calculator along with the hospital’s location. Based on the user’s geography, the Calculator assesses emissions using factors for the “Northern Midwest” region – where the electricity used by the hospital was generated. The user learns that electricity generation and combustion of natural gas associated with annual hospital energy usage causes the release of several tons of harmful emissions, and it is associated with over 460 annual health incidents and approximately $8 million in adverse health and welfare impacts.
Considerations for using the Energy and Health Impact Calculator
Data sources
The updated Calculator draws from several data sources to evaluate the impact of electricity and delivered fuel consumption:
- Emissions associated with electricity consumption: EPA’s AVERT.
- Emissions associated with thermal load: EPA’s AP-42 Compilation of Air Emissions Factors and EPA’s ENERGY STAR program.
- Health and welfare impacts of emissions: EPA’s Co-Benefits Risk Assessment Screening Model (COBRA).
- Value of health and welfare impacts: EPA’s COBRA.
- Other data sources: Federal Reserve Bank of St. Louis, Northeast States for Coordinated Air Use Management’s “Economic Value of Human Health Benefits of Controlling Mercury Emissions from U.S. Coal-Fired Power Plants,” and other EPA documentation.
For complete details on sources consulted, see Appendix A of this document.
Highlights for Calculator users
Total emissions vs. marginal emissions
Calculator users may assess impacts for total energy consumption or a change in energy consumption. This choice is meant to accommodate the range of potential applications for the tool; users may wish to quantify the overall impact of annual facility energy use, assess a change in usage, or compare future alternatives. In any case, total energy impacts are estimated differently from incremental energy (marginal) impacts when considering the electric power grid. To determine emissions associated with total energy consumption, the Calculator uses the appropriate overall average emissions rates, which indicates average emissions associated with each megawatt hour (MWh) of electricity generation in the region of interest. To determine marginal impacts, the Calculator uses region-specific marginal emissions rates sourced from AVERT, with the exception of mercury, which is based on a national average marginal emission rate from the U.S. Energy Information Administration. (Though users may input energy consumption data corresponding to any time interval, since emissions factors are annual average values, inputting annual total energy usage or annual total change in energy usage is likely to produce more accurate estimates.)
Marginal rates capture the average emissions, on a per-MWh basis, of marginal generation units (i.e., marginal power plants) – calculated as the average of the emissions rates of the marginal generation unit during each of the 8,760 hours of the year. The marginal generation unit can be understood as the last to come online when demand increases, or alternatively, the first to be turned down or off when demand falls. In theory, these units will be affected by affected by a change in a customer’s energy usage, so emissions rates should be used to determine incremental effects. Decisions about which generation units to dispatch (i.e., turn on/off or up/down) are typically made on a merit order basis, meaning preference is given to the power plants that can generate electricity most efficiently. Therefore, the marginal unit is often less efficient and more polluting per MWh than the other units that are generating electricity in a given hour.
Endpoint incidence rates
The tool converts estimated regional emissions of nitrogen oxides, sulfur dioxides, and particulate matter associated with a user-generated scenario into the total number of incidents of each endpoint by using endpoint incidence rates derived from COBRA. These rates indicate the average relationship between emissions and endpoint incidence for the three criteria pollutants reported by the Calculator.
For each region, endpoint incidence rates are calculated by running emissions scenarios from AVERT, which indicate the expected county-level changes in emissions associated with a modest decrease in energy usage across this region, through COBRA. These county-level emissions changes are translated into modifications in the ambient pollution level in each county across the contiguous United States using COBRA’s transport model. The effect of changes in county-level ambient pollution on endpoint incidences in turn depends on county-level demographic and epidemiological variables, which are hardcoded in COBRA. The interaction of these factors, the regional geography of emissions changes from AVERT, transport effects from COBRA, and baseline county demographic and epidemiological parameters are all reflected in final endpoint incidence rates that simply express the incremental increase in incidence of each endpoint that can be expected from the incremental release of the given criteria pollutant in the given grid region.
Constant effects
To simplify the analysis, this tool assumes that emissions rates and health incidence rates (sometimes called concentration response functions) do not change with the scale of total emissions or emissions changes. This means that for a given region, impacts are directly proportional to the level of emissions or emissions change. Similarly, the tool treats endpoint incidences as a linear function of emissions. Health Care Without Harm recognizes that the health impacts from emissions are not always linear, especially for vulnerable populations for which a small increase in a health factor may cause disproportionate reaction or harm for a given individual. However, the resolution of the analysis provided by the Calculator requires some assumptions, such as this one.
Averaging
In addition to the averaging that is involved in formulating emissions and health incidence rates, there are several other important input values that reflect averages. While these values represent suitable approximations in most cases, they may deviate meaningfully from the true dynamics in certain instances. Other averaged variables in the Calculator include:
- Mercury impacts are calculated using the nationwide average per-ton figure from Hammitt and Rice study.
- Emissions associated with the combustion of delivered fuel and with district heating are calculated using average values. Though they should not be expected to vary regionally, actual emissions may be substantially different for facilities using newer, cleaner or less common, older, less efficient, and/or otherwise more heavily polluting combustion technologies.
- Incident values are nationwide averages, and reflect, among other things, medical treatment costs, foregone wages, and willingness-to-pay values that may vary significantly both between and within regions.
- Costs are escalated using an average inflation index that may over- or understate the change in medical treatment costs and other costs and values that are associated with the reported endpoint valuation.
- The emissions factors and health incidence rates used for Hawaii and Alaska are largely reflective of average figures for the contiguous United States.
Geographic scale
As grid electricity is drawn from a diffuse, regional network of generating units, electricity impacts occur on a regional basis and the associated air pollutant emissions (non-CO2) and public health impacts are similarly regional, as defined by AVERT and COBRA. Delivered fuel use, on the other hand, occurs locally. Combustion happens onsite or in a district system and the associated emissions are local to the facility and/or district region. However, through COBRA, these impacts are also modeled regionally. Costs associated with CO2 emissions and the social cost of carbon are assessed at the national scale.
Users wishing to better model the local dynamics and effects of onsite fuel combustion are advised to input emissions values associated with delivered fuel usage into COBRA at the county level and with the appropriate stack height selected. Additional guidance may be found in the COBRA documentation.
Inflation and valuation of impacts
All costs and values are reported in 2018 dollars. Where endpoint incidence values are sensitive to earnings and/or income, 2017 national average values are assumed.
Timing of impacts
All incidents are assumed to occur in the year following exposure, except for premature mortality, which may occur over a 20-year period following exposure.
Discounting and valuation of impacts
A discount rate is used to account for the future benefits or costs. While COBRA allows either a 3% or 7% discount rate, the lower rate was applied, assuming premature deaths occurring in the future should be valued closely to premature deaths occurring in the year of analysis. The higher discount rate (7%) favors immediate benefits and reduces the value of future benefits, while the lower discount rate (3%) places a greater value on future benefits to society. To learn more about discount rates and how the EPA uses them in monetizing health benefits, see the COBRA user manual Appendix F.
This approach has an important implication: Premature deaths are valued with little respect to the number of life-years lost. Future premature deaths arising from exposure to pollution in the analysis year might be viewed as less offensive than those occurring sooner after exposure since those who die prematurely from exposure to pollution after some delay are able to live longer than those who die more quickly after exposure.
In the financial realm, the use of discounting reflects the fact that having money now is preferable to having it in the future, as cash in hand may be put to fruitful use, invested to earn a return, etc. There is no similar case to be made for pollution. There is no socially or ethically tenable argument for continuing to emit criteria pollutants in the present, provided the mortality impacts are far enough in the future.
Limitations
The Calculator uses average rates to estimate emissions, health endpoints, and endpoint values for total energy consumption or changes in energy consumption. Results are provided at relatively high resolution. While they should serve as a satisfactory approximation for most users, those requiring more precise analysis should consider conducting a separate study with location-specific factors.
Users should use caution in evaluating multi-year impacts. The Calculator’s results are highly sensitive to pollution baselines, population demographics, and epidemiological parameters. Incident valuation may be influenced by income levels and inflation. While the Calculator has assumed a linear form for its endpoint incidence rates, following COBRA’s practice, the true form for concentration response functions is more likely to be nonlinear. The impacts of changes in baseline population variables and in emissions, compounding year-over-year (exogenous and endogenous), may be substantially mischaracterized by a linear estimation.
This tool also provides conservative estimates of the total damage caused by facility energy usage. It only considers a short list of major pollutants and excludes some pollutant effects, such as ozone effects. The Calculator only considers the harm from nitrogen oxides and sulfur dioxide through the fine particulate channel, but they likely are harmful to human health for other reasons, too. The tool does not account for environmental damage caused by criteria pollutants, and, for many endpoints, it does not deliver a comprehensive societal valuation that includes pain and suffering and other welfare impacts, or the value of disability adjusted life years. Due to dispersal patterns, social determinants of health and other environmental health factors, health impacts and costs of emissions cannot typically be attributed to a given location and population. That said, the Hippocratic Oath has no geographical limit, no exemption because those harmed might be beyond immediate sight or identifiable individuals.
Web and Excel versions
Health Care Without Harm and Practice Greenhealth have produced both web-based and Microsoft Excel versions of this tool.
The web-based version is available on any device with web connectivity (PC, Mac, or mobile device). By using the web version, users will automatically have access to the latest emissions and impact factors as the tool is updated.
The Excel version has all the same inputs and outputs as the online version. It offers the flexibility to run the Calculator offline and save entire runs of the model (including inputs and results). Advanced users have the flexibility to modify factors and formulas to reflect more facility-, region-, or scenario-specific information.
Step-by-step instructions
Information required to use the Calculator
To produce estimates of total emissions, endpoint incidence, and endpoint valuation, the Calculator requires data on energy usage. This may include electric energy consumption and/or delivered fuel consumption, or emissions associated with energy consumption. These figures may be either estimates or exact values, but more precise inputs are likely to produce more precise results.
Inputs
Facility information
The Calculator asks each user to enter their name and identifying information, along with the name and location of their facility and health system. (These fields are optional in the Excel tool but required in the web-based version.) Health Care Without Harm collects this information to learn how people are using the Calculator and support efforts to improve its products. Personal information will not be shared with outside parties.
The Calculator will use your facility’s county and state to determine the appropriate electric power grid region, associated emissions, and endpoint incidence rates for use in calculations. If you are modeling a more generic scenario or trying to assess the impact of energy use across a health system that spans multiple counties or regions (see AVERT region map), you can run separate calculations for representative facilities, or aggregations of facilities, choosing the county hosting your biggest energy-using facility. Alternatively, you can select “national average” from the menu. The Calculator does not yet have the ability to produce state-wide results, but data for that type of analysis can be found in this paper produced by the U.S. Energy Information Administration.
Users may also elect to input additional facility details – adjusted patient days, number of beds, and square footage. This enables the Calculator to output impact metrics using industry-standard metrics.
Scope of analysis
From the dropdown menu, select whether you are interested in seeing impacts associated with “total energy use” or those arising from a “change” in energy use. Note that the emissions factors associated with these two options are different, with the emissions impacts of changes in energy usage usually greater, on a per energy unit basis, than impacts associated with total usage (see the “Total emissions vs. marginal emissions” section above).
Users should only select the “change” in energy use option in a few cases:
- A past or planned increase or decrease in electric or thermal energy usage.
- A past or planned increase or decrease in the portion of energy consumed from renewable sources.
In all other cases, users should select the “total energy use” option.
If you have chosen to input total energy figures, the Calculator will present the choice between entering facility energy use (in kilowatt-hours) or entering facility emissions (in pounds). Users evaluating a change in energy use must enter this change, and not an associated emissions effect. Most Calculator users will enter energy consumption data, not emissions data, since the latter is generally not easily accessible to energy consumers. Users with on-site systems, such as combined heat and power plants, may have highly specific and accurate emissions data to input.
Data entry
The Calculator chooses which fields to present in this section based on whether the user will input energy or emissions data. Instructions for each alternative are provided below.
Energy data can be collected using energy invoices from all purchased sources and fuel types, and records of on-site generated energy. Contact the facility/energy manager to access to your facility’s energy bills or energy data management system (e.g. Energy Star Portfolio Manager).
If the user chooses to enter energy use data, enter the total electricity purchased from the grid, or the total change in electricity purchased from the grid, in kilowatt-hours (kWh). If data is in another unit, such as megawatt-hours (MWh), convert to kWh using the factors and/or calculator provided in the unit conversion table below this field.
Kilowatts (kW) and megawatts (MW) are units of power, not energy. In the context of facility energy usage, these values are used to describe the peak demand, or highest instantaneous energy usage. Such values should not be used in the Calculator because they do not represent total energy consumption.
Enter the percent of purchased renewable electricity. Only complete this field if some portion of total purchased electricity is specifically procured from renewables, either directly from the utility, or from some other third party. Do not enter the baseline percentage of grid power that comes from renewables, as this is already reflected in the grid emissions factors.
If you entered your total purchased electricity in the field above, you do not need to include any renewable energy that you produce onsite when calculating your renewable percentage. That’s because your onsite generation total has already been excluded from the amount of electricity you purchase.
If you entered your total electricity consumption as the starting point above, then the percentage you enter here should include your onsite renewable energy production (if any) along with any renewable energy you purchase through the grid. This will ensure that you’re accurately calculating the percentage of your total consumption that is renewable.
Enter the total delivered fuel used or the change in the total delivered fuel used. Use the unit conversion table below as necessary to convert to the required units.
If you chose to enter emissions data, add the total emissions in pounds of carbon dioxide, sulfur dioxide, nitrogen oxides, fine particulate matter, and mercury. If data are in different units, use the unit conversion table below this field to convert to pounds.
Outputs
After fields have been completed, click the button at the bottom of the screen to advance to the outputs page, which has two sections: emissions impacts and public health impacts and values.
Emissions impacts
This section presents the expected emissions associated with total energy usage or the change in energy usage. Results are provided in a matrix organized by pollutant and energy use type.
Emissions results may represent estimates of pollutants released as a result of total or incremental energy consumption, or pollutants not released due to an energy consumption reduction or increase in the share of energy from renewable sources.
Figure 2 – Emissions impacts screen on the Calculator

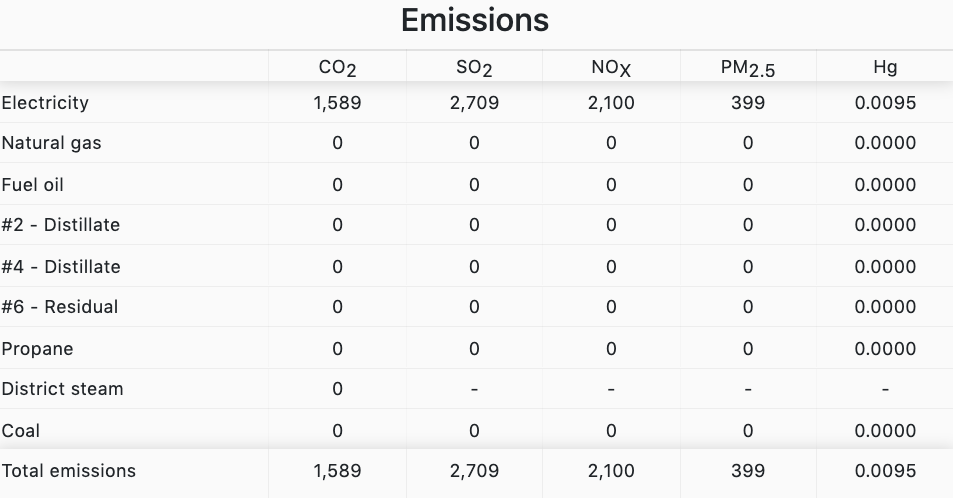
If facility details were provided by the user, emissions will also be provided as metrics on an adjusted patient day, per bed, and per thousand square foot basis, as possible.
For ease of use, impacts of less than one-tenth of the respective unit are simply reported as “≈0” rather than as exact values.
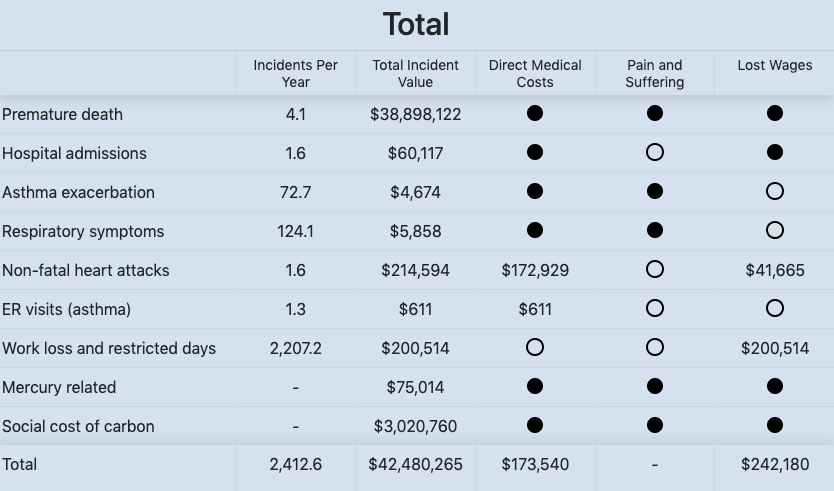
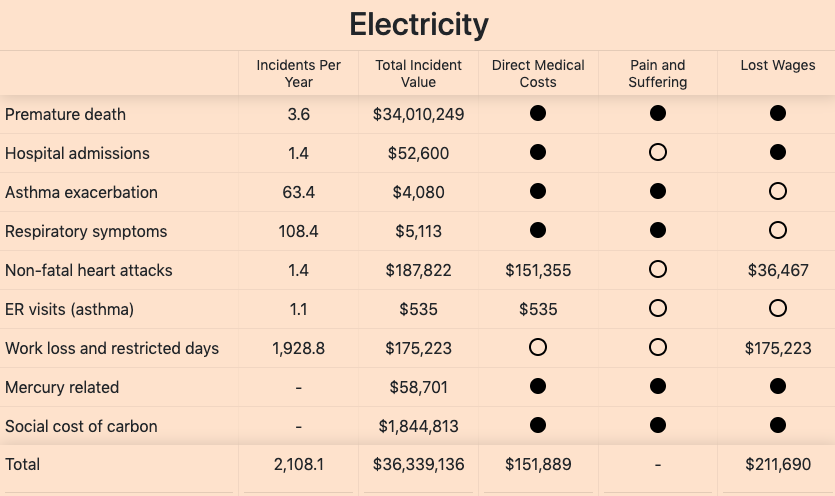
Public health impacts and values
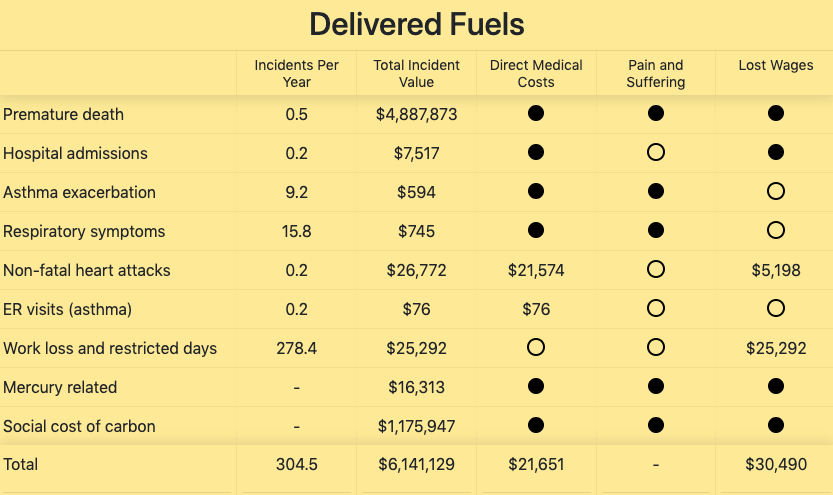
This section presents the expected impacts of the emissions or emissions reductions resulting from total energy use or change in energy use. Figure 3 below shows three tables with public health impacts.
The final three columns provide more detail on the composition of the total values, which may include direct medical expenses, the monetized value of pain and suffering, and/or lost wages. The last three columns present a disaggregation of the total endpoint incident values, breaking these composites into direct medical costs, pain and suffering, and lost wages. Where constituent values are known, they are provided. If constituent values are unknown, either a black or hollow circle is presented. A black circle means that this component is reflected in the total value figure but cannot be disentangled from the whole; a hollow circle indicates that the component is not reflected in the total value and this total value likely understates the true value.
Note that incidents are estimated probabilistically. The results may be fractional. Though fractional incidents do not make sense in the real world where these events are essentially binary (a non-fatal heart attack either occurs or does not), the fractional portion of the output may itself be interpreted conditionally. For example, if the Calculator estimates that 1.2 non-fatal heart attacks will occur as a result of total facility emissions, it is more likely that one non-fatal heart attack will occur. A screenshot of these three results panels is provided in Figure 3. For ease of use, impacts of less than $1 are simply reported as “≈0” rather than as exact values.
For user convenience and in order to provide dollar outputs for the lowest common range of inputs, the Calculator displays emissions and dollar values as small as single digits. “Total impact per kWh” and “Total impact per MMBtu” are displayed to five decimals because it is not unusual for large, long term energy contracts to be negotiated down to the thousandths of a penny. Users may wish to compare this level of price sensitivity to the – typically much larger – per unit health incident values and medical costs of associated energy use or savings. This specificity should not be interpreted as reflecting impact accuracy to such a degree. This specificity should not be interpreted as reflecting impact accuracy to such a degree.
Figure 3 – Public health impacts and values screen

View sources and notes
The Excel tool has a link that will display a complete list of the data sources used in determining emissions rates associated with both electric and non-electric energy use, rates of occurrence for the health and welfare endpoints and endpoint valuation rates. Background on sources and approaches used in synthesizing the results of multiple sources are also provided.
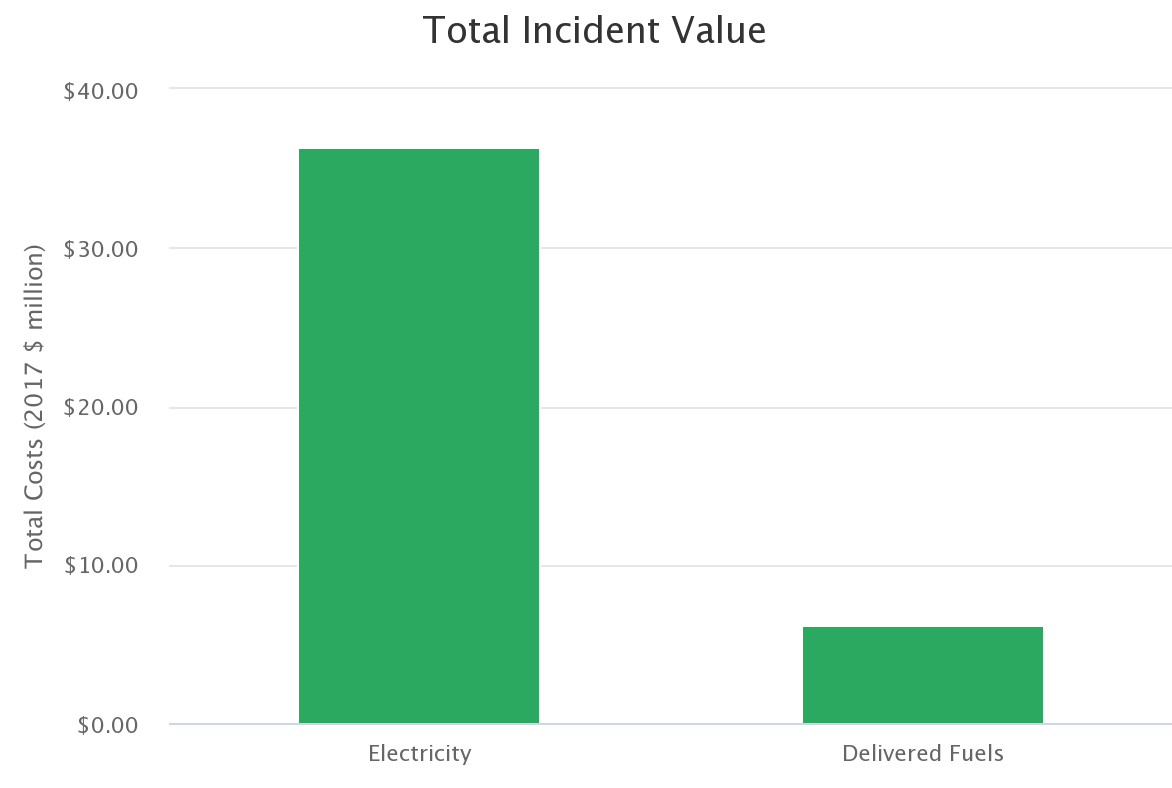
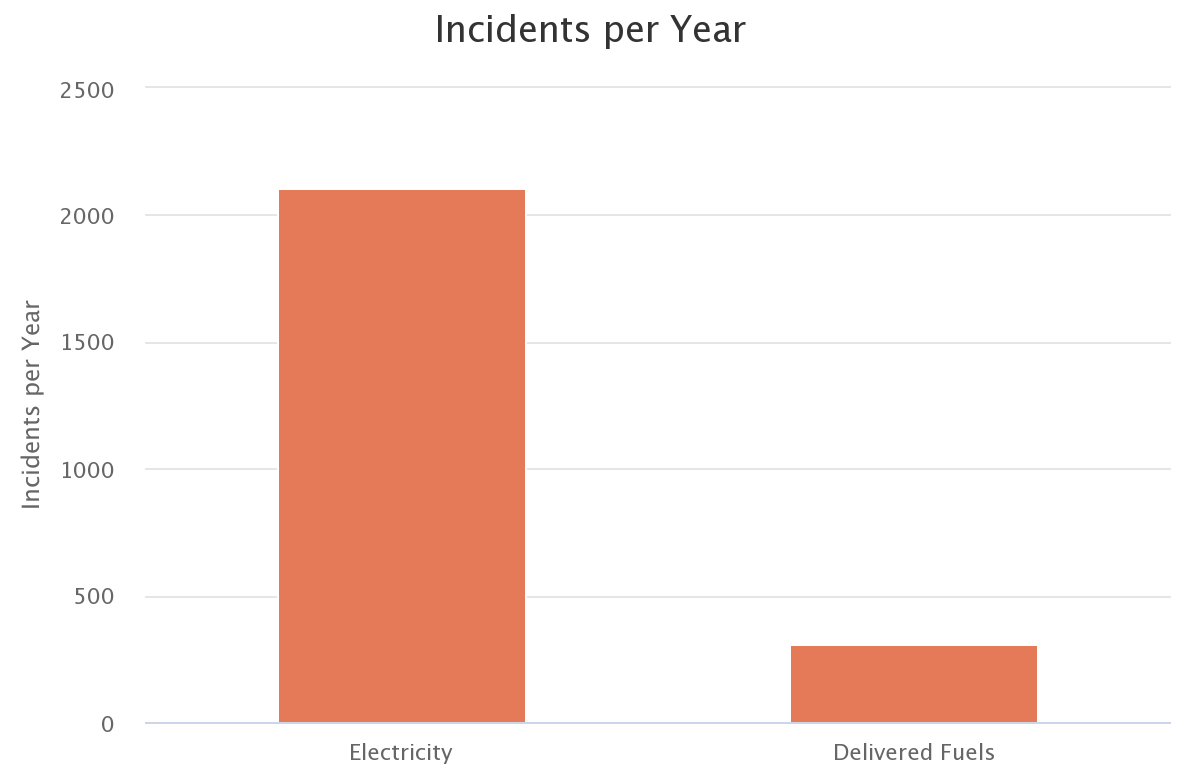
View charts
The Calculator automatically generates graphs representing the number of public health incidents and the associated values and provides the emissions of CO2 and other pollutants resulting from energy consumption.
Figure 4 – Examples of graphs generated

Exporting outputs
Users may wish to share results in presentations, reports, or other settings. The Calculator’s outputs, including tables and graphs, may be exported in a few ways:
- The web-based version provides two buttons below each table:
- “Download CSV” will export the data to a comma-separated values (CSV) format. This option is useful for anyone who wishes to store and use the data in a spreadsheet program like Excel.
- “Download image” will capture a screenshot of the table, which will download in a PNG format. The resulting file is an image that can easily be saved, shared, and pasted into other documents. Words and numbers cannot be edited, formatted, or copied out of the image.
These buttons may be absent or disabled on some devices (particularly mobile devices) and in certain web browsers that block the necessary format conversions. If you encounter this situation, try again on a full-size computer using a browser with known compatibility (for example, Google Chrome).
- The web version allows users to download each graph individually. The menu button at the top right corner of each graph will allow you to download the graph as a static image (PNG or JPEG), a PDF, or a vector image (SVG) that can be edited with certain graphics software.
- The Excel version allows users to copy tables and graphs using the computer’s built-in “cut-and-paste” functionality. To copy a specific item, right-click on it, and select “copy.” Then, right-click in the destination and select “paste.”
- To copy an entire screen from either Excel or the web-based version, take a screenshot by pressing the “Print Screen” key on your computer’s keyboard (often abbreviated as “PrtSc”). Then, right-click in the destination and select “paste.”
Interpreting results and templates
It is important to translate these results into terms your audience will understand and appreciate. Health Care Without Harm and Practice Greenhealth have provided two different “take action” templates: a PowerPoint slide deck and a Word document report format. Each of these templates include suggestions on how to present this information for different audiences (executive suite/leadership, sustainability teams, clinicians) for maximum impact. The templates have space allocated to enable users to paste outputs from the Calculator.
Appendix A
The main data sources for the Calculator are:
- U.S. EPA's CO–Benefits Risk Assessment (COBRA), a screening model that helps state and local governments explore how changes in air pollution from clean energy policies and programs, including energy efficiency and renewable energy, can affect human health at the county, state, regional, or national levels.
- U.S. EPA's AVoided Emissions and geneRation Tool (AVERT), which estimates the emissions benefits of energy efficiency and renewable energy policies and programs.
- The extensive health impacts and cost and value data used in the U.S. EPA Regulatory Impact Analysis for the Clean Power Plan Final Rule.
Details on these and other sources are provided below, along with important caveats on certain ranges and valuations.
|
Emissions rates |
|
|
Electric sector emissions rates |
Marginal emission rates for CO2, SO2, NOX, and PM 2.5 are from AVERT, 2017 version. Emission rates available at https://www.epa.gov/sites/production/files/2018-06/documents/avert_emission_factors_06-01-18_508.pdf. AVERT available at https://www.epa.gov/statelocalenergy/avoided-emissions-and-generation-tool-avert. Each county is assigned to a specific AVERT region.
Average emission rates for CO2, SO2, and NOX are from EIA, available at https://www.eia.gov/electricity/data/emissions/. Data aggregated by balancing authority, which has been aggregated to AVERT regions. Each county is assigned to a specific AVERT region. Average emission rates for PM 2.5 are based on AVERT emission rates (which are marginal) for individual plant types in AVERT's Future Year Scenario Template. These emission rates were then applied to plant-specific emissions data from EIA at https://www.eia.gov/electricity/data/emissions/, then aggregated to AVERT region.
Hg emission rates (marginal and averaged assumed to be the same) is based on data estimated by EIA in the 2019 Annual Energy Outlook, available at https://www.eia.gov/outlooks/aeo/. Emissions data is available by EMM region, which have been aggregated to AVERT regions. |
|
Non-electric sector emissions rates |
Data retrieved from EPA. AP 42, Fifth Edition, Volume I Chapter 1: External Combustion Sources. Fuel oil data from section 1.3 (available at https://www3.epa.gov/ttn/chief/ap42/ch01/final/c01s03.pdf). Natural gas data from section 1.4 (available at https://www3.epa.gov/ttnchie1/ap42/ch01/final/c01s04.pdf) Propane data from section 1.5 (available at https://www3.epa.gov/ttnchie1/ap42/ch01/final/c01s05.pdf).
|
|
Health endpoint incidence rates |
|
|
Premature death |
Data retrieved from COBRA version 3.2. Figure is based upon two component values: the total expected premature infant mortality, which is assumed to occur in the year of exposure, and the total expected premature mortality among the general population, ages 25 and over, which is assumed to occur up to 20 years following exposure. Sources. Infant mortality: Woodruff, et al. (1997). General mortality. Average of Krewski, et al. (2009), and Lepeule, et al., (2012). |
|
Hospital admissions |
Data retrieved from COBRA version 3.2. Figure represents the total expected hospitalizations for respiratory and cardiovascular illnesses, excluding heart attack. Respiratory estimate is from the pooled results of five studies that examined different age cohorts and symptoms: Babin et al. (2007) and Shaphard, et al. (2003), who studied asthma hospitalizations among 0-17 year-olds, Moolgavkar, et al. (2000), who studied COPD among those 18-64 years-old, and Zanobetti, et al. (2009), and Kloog, et al. (2012), who studied all respiratory hospitalizations among those 65 years-old and older. Estimated incidence of cardiovascular hospitalization comes from the pooled results of five studies. Four considered those 65 and old: Peng, et al. (2008), Peng, et al. (2009), Zanobetti, et al. (2009), and Bell, et al. (2008). Moolgavkar, et al. (2000) considered cardiovascular hospitalization among those 18-64 years of age. |
|
Asthma exacerbation |
Data retrieved from COBRA version 3.2. Figure represents the expected number of person-days in which one of four asthma symptoms is exacerbated: cough, wheeze, shortness of breath, or upper respiratory symptoms. Note that an individual experiencing all four on a single day would be counted four times. This value includes just those aged 6-18 years old, since adult asthmatics experiencing the same symptoms are expected to be counted in the separate Work Loss and Restricted Days category. Values are derived from three studies: Ostro, et al. (2001), Mare, et al. (2004), and Pope, et al. (1991). |
|
Lower respiratory symptoms |
Data retrieved from COBRA version 3.2. Figure represents the expected number of person-days of lower respiratory symptoms, including acute bronchitis, among just children. Adult experiencing the same symptoms are expected to be counted in the separate Work Loss nad Restricted Days category. Incidence of general lower respiratory symptoms is from Schwartz & Neas (2000), and acute broncitis incidence is from Dockery, et al. (1996). |
|
Non-fatal heart attacks |
Data retrieved from COBRA version 3.2. Value based on pooled results from five studies: Peters, et al. (2001), Pope, et al. (2006), Sullivan, et al. (2005), Zanobetti and Schwartz (2006), and Zanobetti, et al. (2009). |
|
ER visits (asthma) |
Data retrieved from COBRA version 3.2. Value is based on results from three studies: Mar, et al. (2010), Slaughter, et al. (2005), and Glad, et al. (2012). Note that this figure represents incidences among all ages, and is distinct from the asthma exacerbation value that is separately reported. |
|
Work loss & restricted days |
Data retrieved from COBRA version 3.2. Sum of expected number of person-workdays missed and expected number of person-minor-activity-restricted-days. Work loss is based on Osto (1987), and restricted days is based on Ostro and Rothschild (1987). Note that Ostro (1987) did not consider workers over 65 years-old, who are likely to be more susceptible to pollution. Note that incidences in other categories such as hospital admissions should at least theoretically appear in this category too. |
|
Mercury related |
No incidence rate value used; the impact of this health endpoint is considered in terms of a monetary value only. |
|
Social cost of carbon |
No incidence rate value used; the impact of this health endpoint is considered in terms of a monetary value only. |
|
Health endpoint valuation rates |
|
|
All values are in 2017$, and where relevant, assume 2017 income levels and a 3% discount rate. |
|
|
Premature death |
Data retrieved from COBRA version 3.2. Premature mortality among adults is valued at approximately $10.6 million. This is an intermediate value based on a review of 26 published studies, and has been widely used by EPA. Note that premature mortality results include all pollution-driven premature deaths occurring up to 20 years after exposure, so valuation of individual incidents on a present value basis is sensitive to the choice of discount rate. Conventionally, either a 3% or 7% discount rate is used. This tool applies the lower rate, to the effect of putting future events on a more equal footing with nearer-term ones, and increasing the overall benefits of avoided premature mortality. |
|
Hospital admissions |
Data retrieved from COBRA version 3.2. Hospital admissions valuation varies from $17,320 to $46,025. Value per incident reflects the expected cost of hospitalization, and lost wages (for those between 18-64 years of age, regardless of employment status), but excludes pain and suffering and other societal values. The average hospitalization cost is differentiated by health endpoint, and is taken from the National Inpatient Sample (NIS) database (2007). This database also provides average hospitalization duration data by health endpoint, which is multiplied by the average of the national median wages for men and women to produce value corresponding to the opportunity cost of lost wages. The two results are summed, producing a final hospital admission value, differentiated by health endpoint and age cohort. |
|
Asthma exacerbation |
Data retrieved from COBRA version 3.2. Valued at $64.54. Based on the willingness-to-pay study results of Rowe and Chestnut (1986). |
|
Lower respiratory symptoms |
Data retrieved from COBRA version 3.2. Lower respiratory symptoms are valued at $23.41, based on the willingness-to-pay study results of Schwartz, et al. (1994). This study valued four different symptoms in isolation, and the value above represents the average of total values for all different possible symptom clusters. Acute bronchitis is valued at $535, based on EPA's Section 812 Prospective analysis (1999) midpoint value of $59.31 for one day of symptoms, multiplied by 6 for the average illness duration, and then escalated for inflation and real income gains. Note that no willingness-to-pay values were available. |
|
Non-fatal heart attacks |
Data retrieved from COBRA version 3.2. Values range from $110,176 to $223,264. Similar to the approach taken with valuing hospitalization, non-fatal heart attacks are valued based on the sum of expected cost of treatment and the opportunity cost of foregone wages. In this case, opportunity costs are expected to span multiple years, and so the choice of discount rate will impact results. A 3% discount rate is assumed. Opportunity costs are differentiated by age cohort within the overall working-age population, 18-64. Medical costs are assumed to be the same regardless of age. Opportunity costs are based on Cropper and Sussman (1990). Medical costs are based on three studies: Wittels, et al. (1990), Russell, et al. (1998), and Eisenstein, et al. (2001). Note that no willingness-to-pay values were available. |
|
ER visits (asthma) |
Data retrieved from COBRA version 3.2. Valued at $478. This figure is the average of Smith, et al. (1997) and Stanford, et al. (1999). |
|
Work loss & restricted days |
Data retrieved from COBRA version 3.2. Work loss days are valued at $46,621 per year, which is the average of median male and female full time annual earnings, or $179 per day. Minor restricted activity days are valued based on willingness-to-pay to avoid a minor respiratory restricted activity day (MRRAD), from Tolley, et al. (1986). |
|
Mercury related |
Rice and Hammitt. "Economic Valuation of Human Health Benefits of Controlling Mercury Emissions from U.S. Coal-Fired Power Plants" (2005). Harvard Center for Risk Analysis. This paper provides a high-end range of $182 million/ton (2000$) to $194.5 million/ton (2000$) for annual benefits, in avoided neurotoxicity and cardiovascular illness, of avoided mercury emissions from power plants. We average these values to $188.25 million/ton, and escalate this to 2017$. |
|
Social cost of carbon |
Technical Update of the Social Cost of Carbon for Regulatory Impact Analysis Under Executive Order 12866 (May 2013, Revised August 2016). Available at https://19january2017snapshot.epa.gov/climatechange/social-cost-carbon_.html. |
Acknowledgments
Health Care Without Harm thanks the following hospitals and health systems for their feedback during the development and review process:
- Advocate Aurora Health
- Cleveland Clinic
- Gundersen Health
- Inova Health
- Kaiser Permanente
- Partners HealthCare
- Providence St. Joseph Health
- ThedaCare
Thank you to ERG and Synapse for their expertise in updating this tool.
 |
 |
Visit the calculator.